Much has been made of the recent performance of large U.S. technology stocks. In particular, the performance of the FAANG[1] stocks has captured the imagination of many investors.
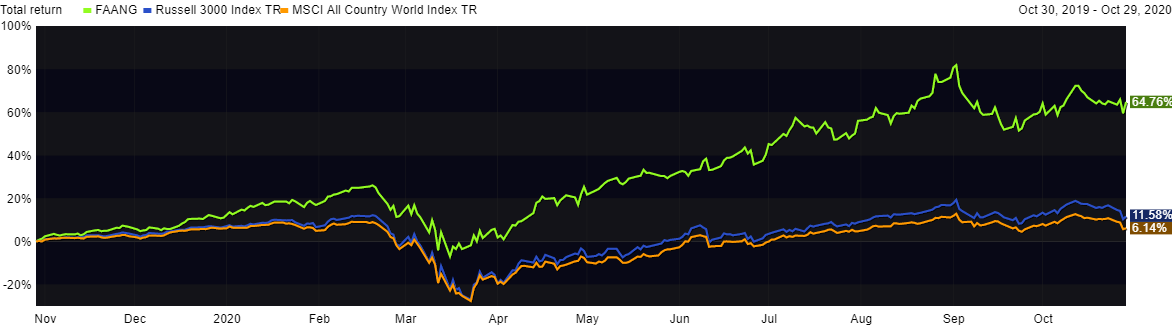
To frame the discussion, let us look at how FAANG stocks have performed compared to standard benchmarks over the recent past. Over the prior year ending October 29, 2020, an equal weighted portfolio of the five FAANG stocks returned 64.8% compared to 11.6% for U.S. Stocks (Russell 3000 index) and 6.1% for Global stocks (MSCI All Country World Index).
Chart 1: FAANG vs U.S. and Global Equity (One Year Return)
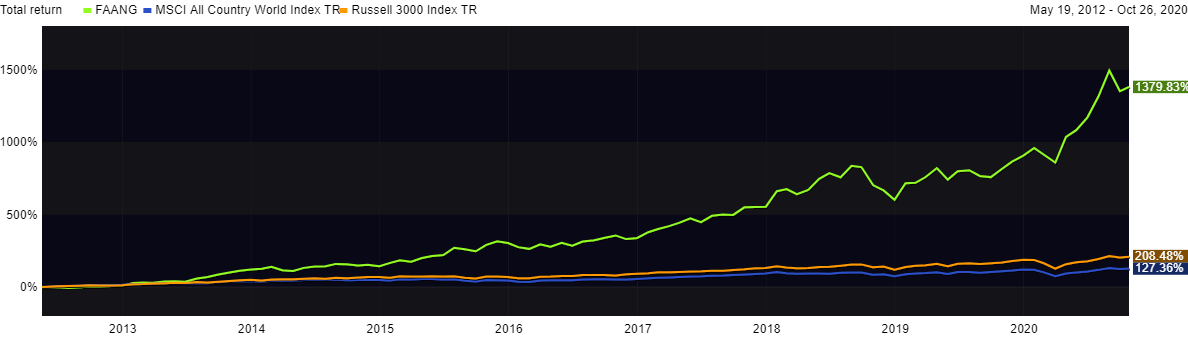
We can also look at a longer period of time to see just how impressive the FAANG stock performance has been. Starting on May 18, 2012 (the date of Facebook’s initial public offering), FAANG stocks achieved a total return of 1,379% compared to 208% for U.S. stocks and 127% for Global stocks. On an annualized basis the returns were 37.6%, 14.3% and 10.2% respectively.
As a result of the long-term outperformance, four of the five FAANG stocks are now among the top ten largest companies in the U.S. as measured by market capitalization (total number of shares multiplied by the stock price) as of October 26th 2020. (Netflix is ranked 24th)
Chart 2: FAANG vs U.S. and Global Equity (Since Facebook IPO)
Clearly, the performance (both recent and longer term) of these five stocks has been spectacular. The pertinent question for investors though is what to expect going forward. Should investors in FAANG stocks expect similar outperformance over the next period? Should they expect outperformance of the broad market indices at all?
We would all like to be able to peer into the future to see if the FAANG stocks will continue to be great performers but short of being Nostradamus, we need to rely on a different approach to answer these questions. Below are two such approaches we can use to assess the likelihood that FAANG stocks will generate a repeat performance over the next decade.
What happens to stocks after they enter the top ten list of largest companies?
One approach looks at how top 10 stocks perform by examining how stocks perform both before and after they enter the group of the top ten largest stocks. The data in the chart below allows us to answer that question. We can see that the excess performance of top 10 stocks is solely a characteristic of these stocks before they make the top 10 list. Once they reach those lofty levels, excess market performance dissipates quickly and, on average, turns to underperformance versus the market. For investors, the lesson here is that even for the most successful companies and their stocks, outperformance does not last forever.
Chart 3: Annualized Return in Excess of Market for Top 10 Stocks
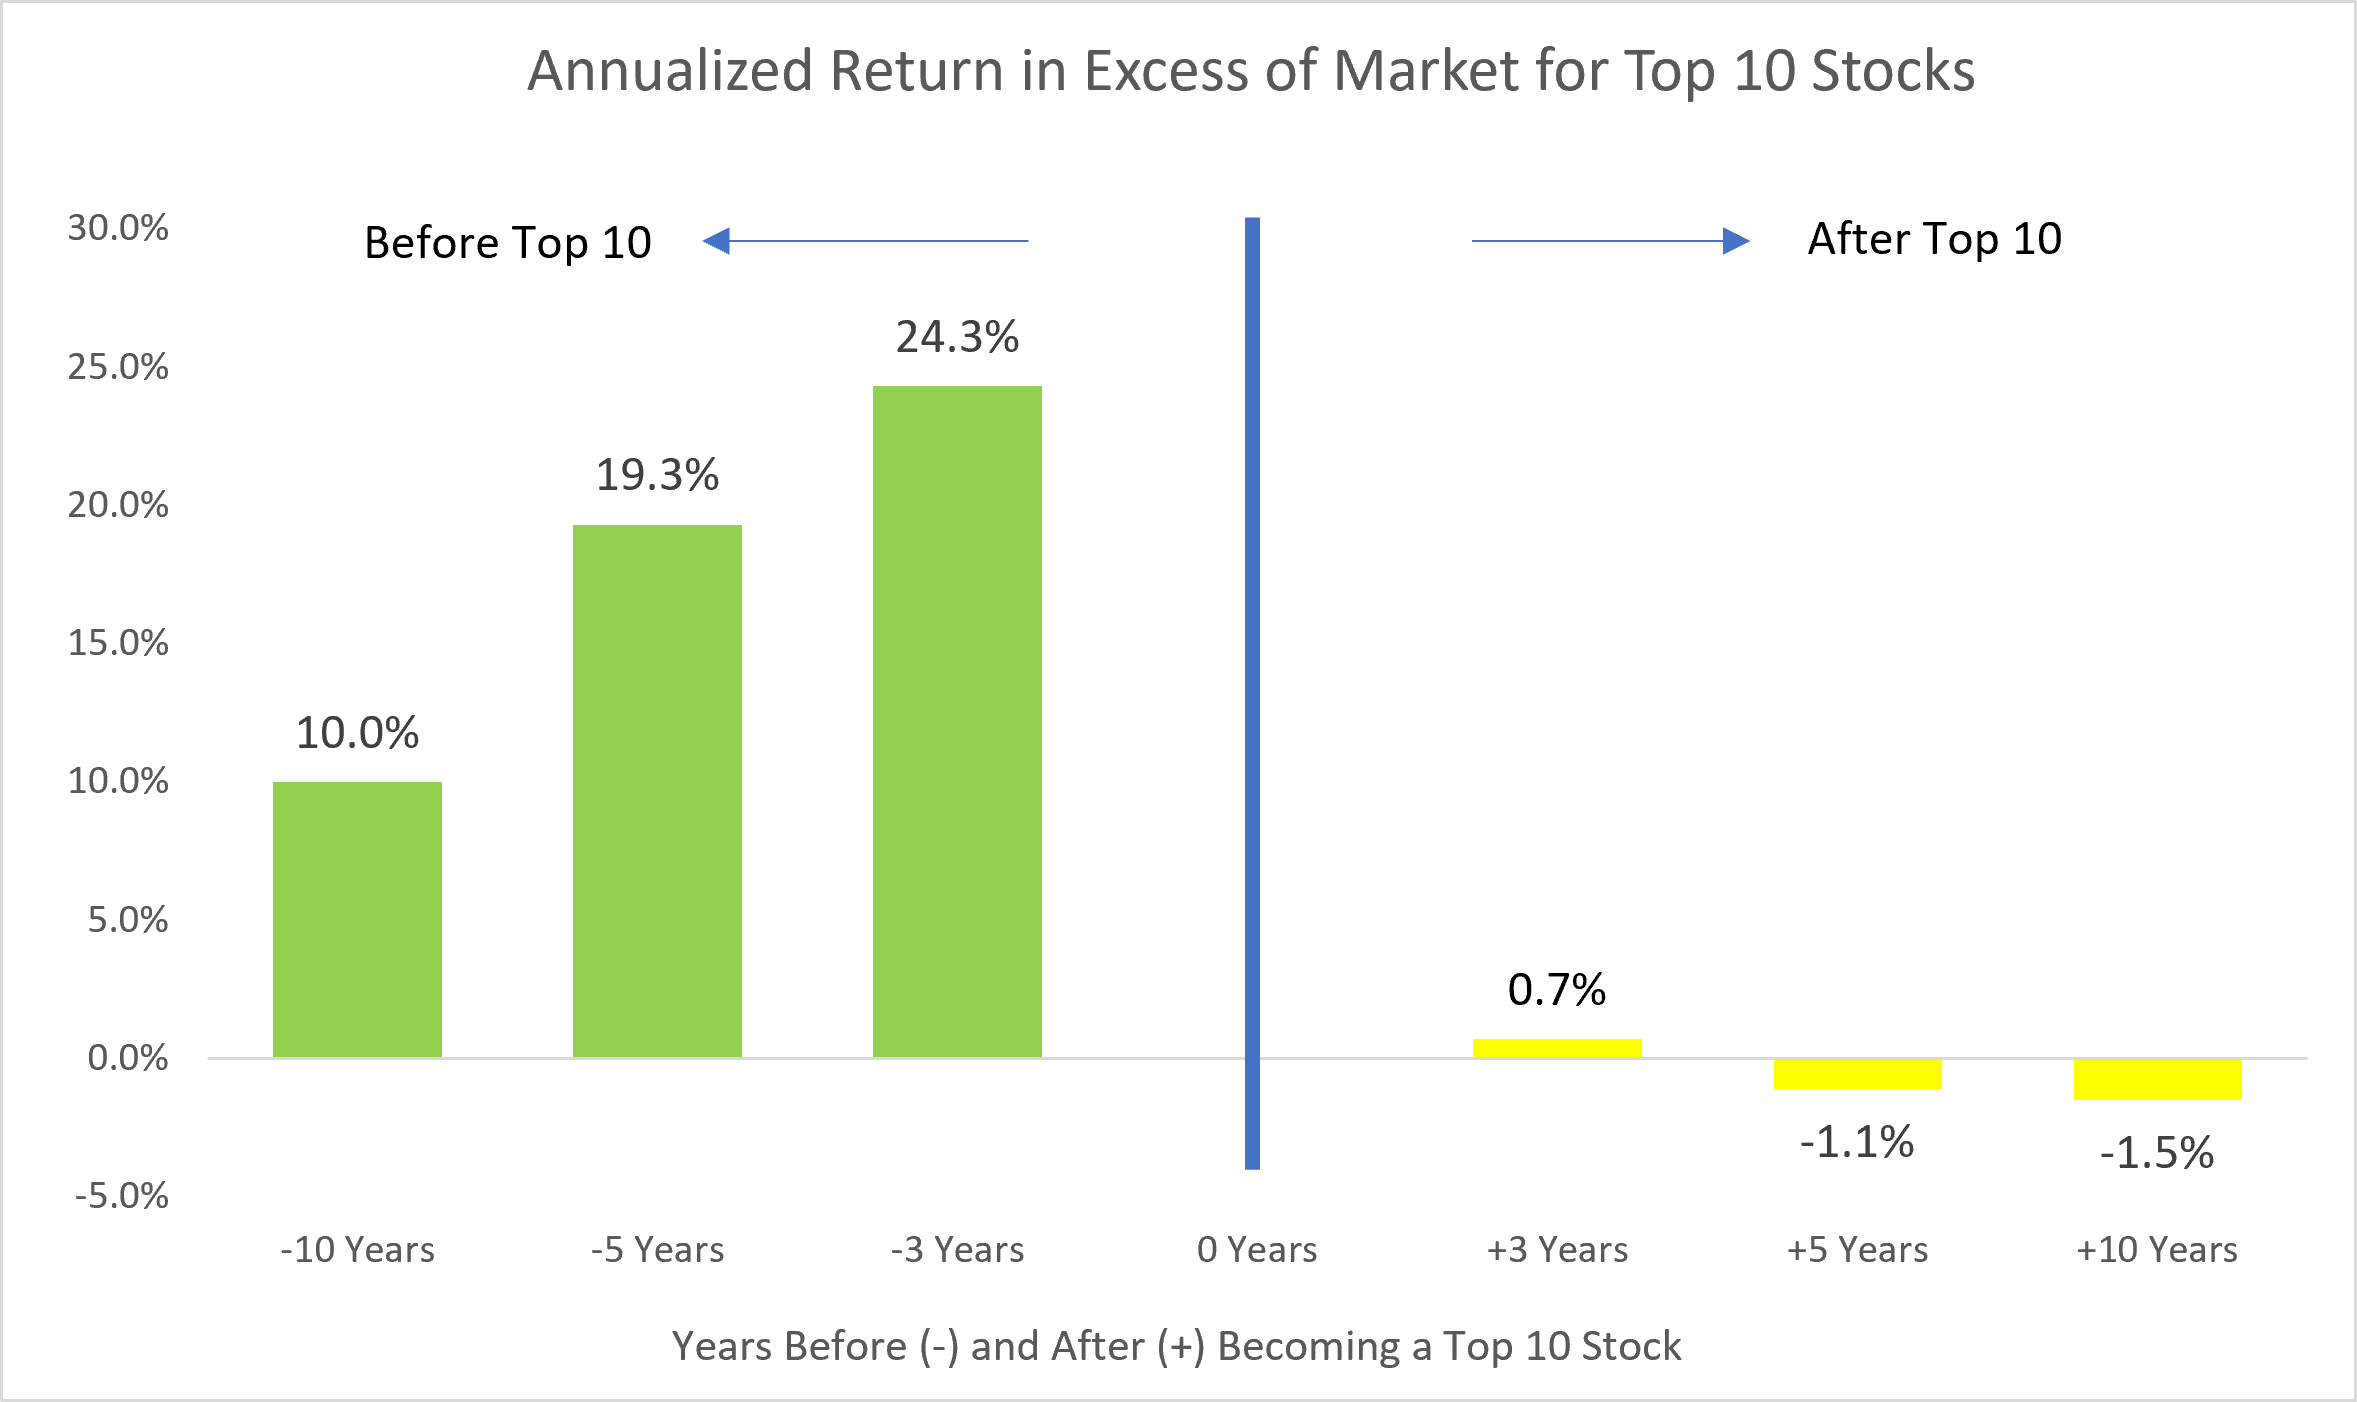
Source: Dimensional, using data from CRSP.
What does the U.S. stock market look like in ten years with continued FAANG stock outperformance?
A second way of looking at the question of FAANG future performance is to simply assume FAANG stocks continue to outperform the U.S. market at the same rate. As of October 2020, FAANG stocks accounted for approximately 15% of the total U.S. market. If we project continued outperformance equal to the historical data (annualized returns of 37.6%, 14.3% and 10.2% for FAANG, U.S. and Global respectively), in ten years FAANG stocks would account for 96% of the U.S. stock market. Do today’s investors in FAANG stocks expect them to account for virtually the entire U.S. stock market ten years from now?
Chart 4: FAANG as a % of U.S. Stock Market – Continued Historical Outperformance
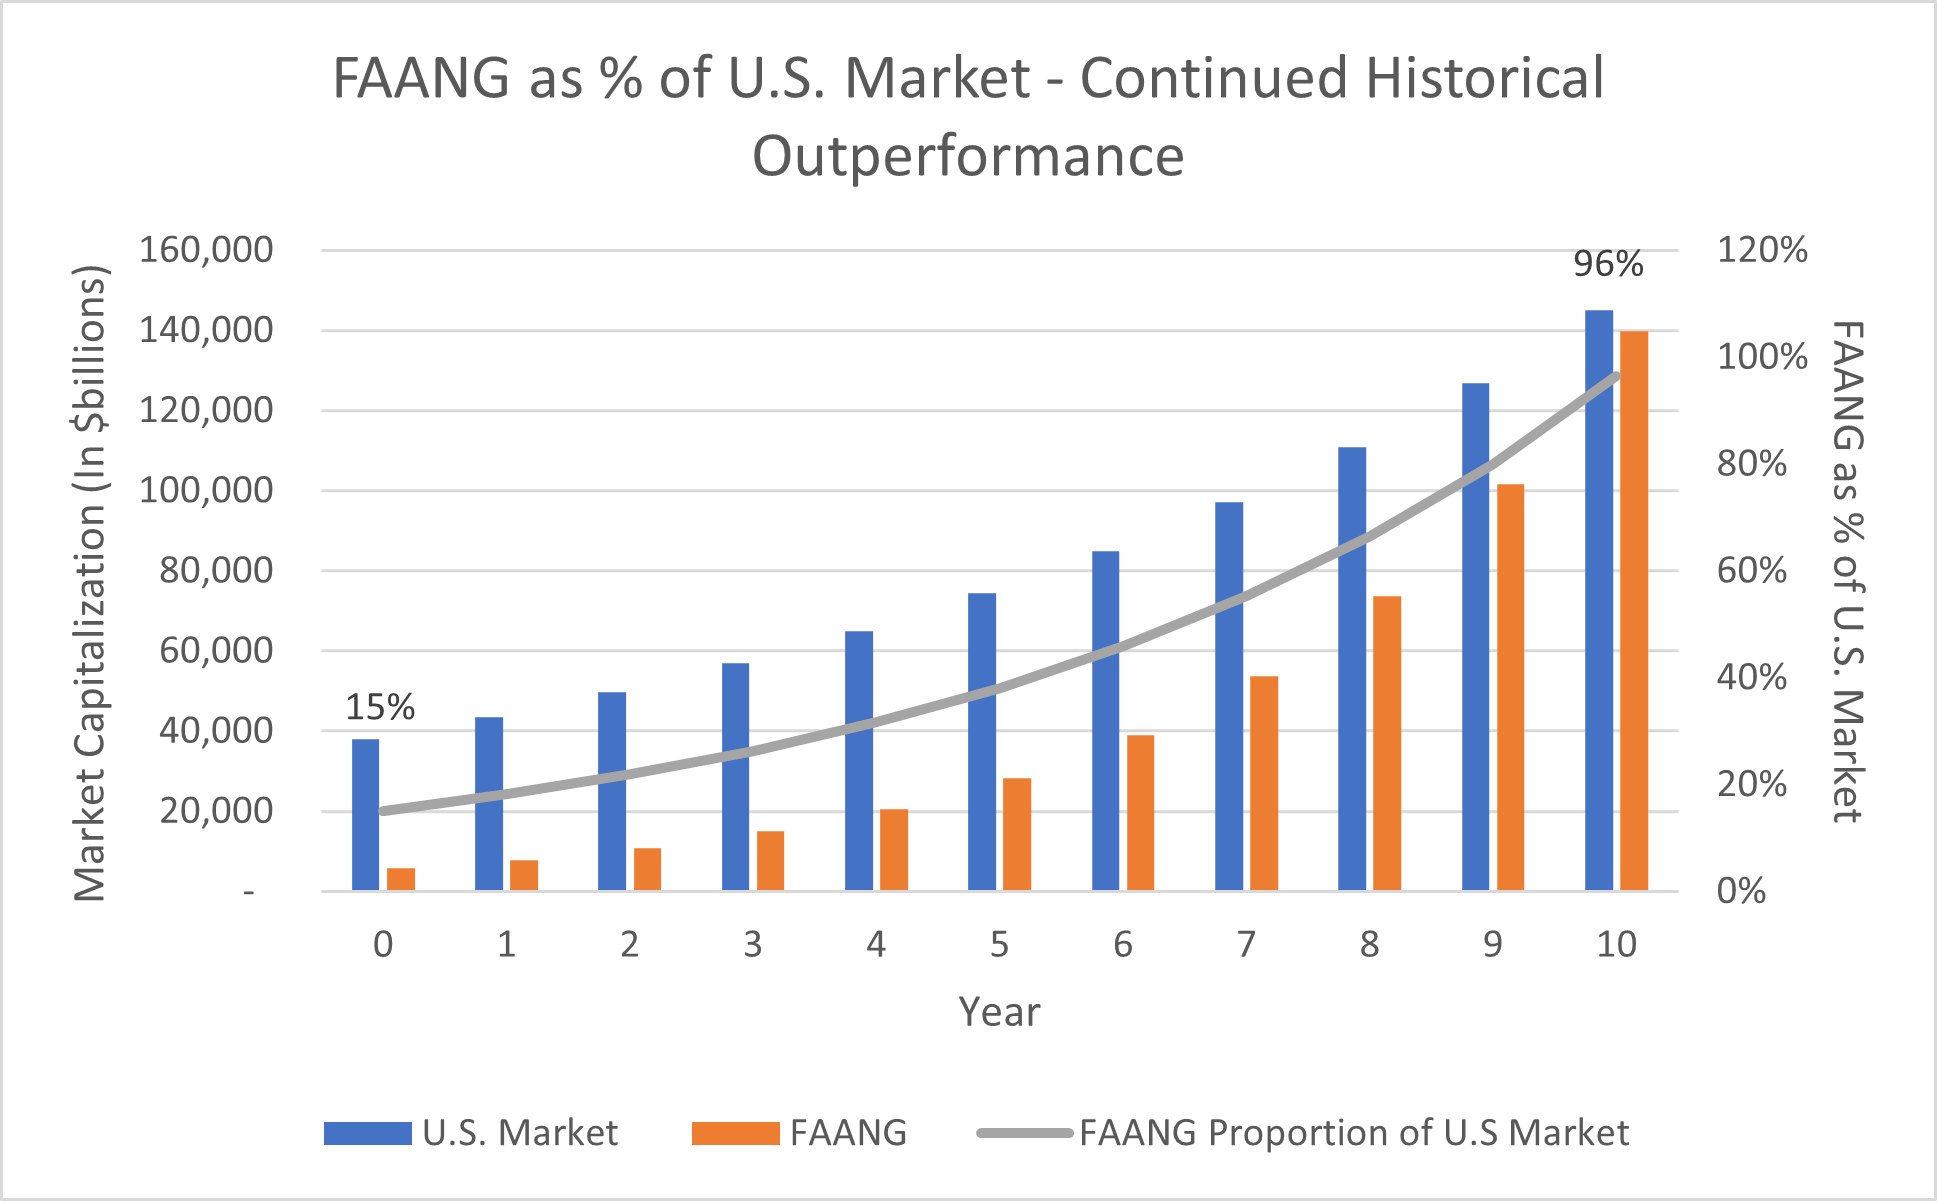
Source: FTSE Russell, Fifth Set estimates
We cannot predict the future in stock picking or anything else for that matter. However, we can use reasonable approaches like the two reviewed here to make assessments of the likelihood of specific outcomes. The results of both approaches strongly suggest that FAANG investors expecting future outperformance comparable to previous realized returns will be disappointed.
As always, the Fifth Set approach encourages broad equity market coverage as the best way to ensure exposure to the “FAANG” stocks of the future.
[1] FAANG – Facebook, Amazon, Apple, Netflix and Google (Alphabet). The equal weighted portfolio is comprised of 20% of each stock.