One of the differences between investing in investment grade bonds and stocks, is that the market provides more information about what to expect from future bond returns then stocks returns. With stocks, while we know the current dividend yield (the stock dividend divided by the stock price) and this is a significant component of future stock returns, there is otherwise very little we can point to that tells us what to expect from stocks over the short/medium term. It’s worth noting that stock valuations may offer some insights over much longer periods of time like ten or twenty years.
On the other hand, for investment grade bonds, we have yield curves which show what bonds offer for lending money for different periods of time. Typically, yields are lower for shorter periods of time and higher for longer periods of time, reflecting in part, the increased risk of lending money for longer periods of time. Recently, however, the yield curve has been “inverted”, meaning that yields are higher for shorter term bonds and lower for longer term bonds.
This yield curve inversion poses a question for how to position the bond portion of an investor’s portfolio. Should we maintain a more typical maturity target that we would expect to have higher returns over time (i.e. intermediate term bonds typically have higher returns than shorter term bonds, this is referred to as the “term premium”), or use the information the market provides through the yield curve, and adjust fixed income maturities to target the higher yielding portions of the yield curve?
The current bond market gives us an excellent source of data to explore this question. As a starting point, we can view the treasury yield curve on July 26, 2023, the date of the last Federal Reserve interest rate hike.
Chart 1: Treasury Yield Curve – July 26, 2023
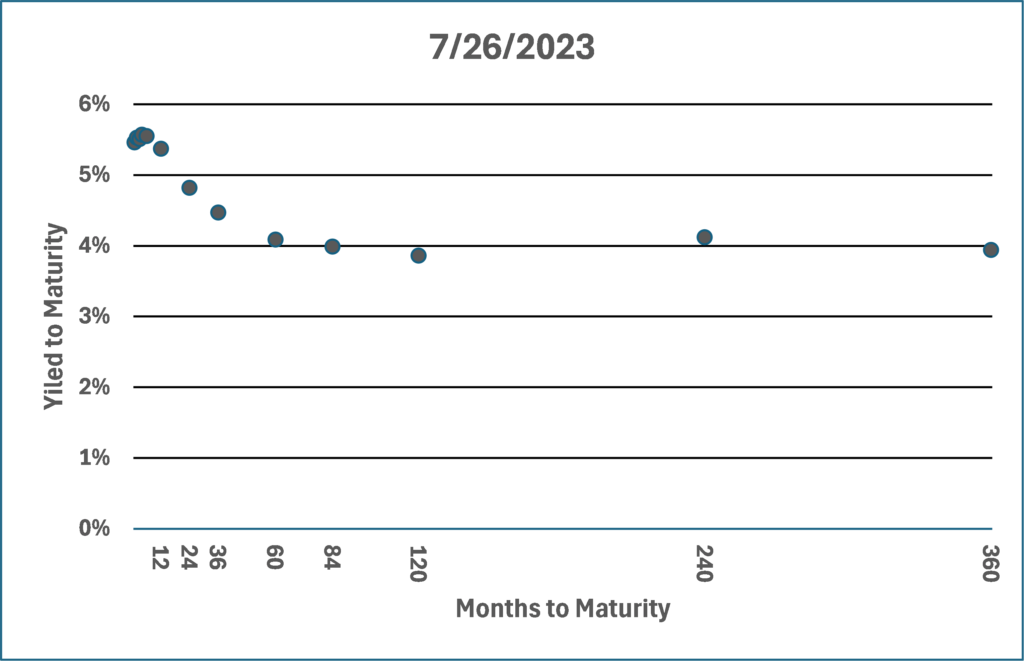
We can see from the curve that very short-term bonds were yielding significantly more than longer term bonds.
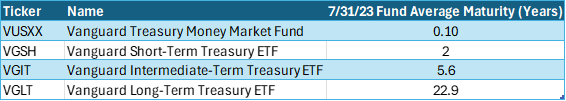
To answer our question, first we chose four Vanguard ETFs as proxies for different parts of the yield curve. They all hold treasury bonds so the only material difference between the funds being compared is the average maturity of the bonds in the portfolios.
Table 1: Vanguard Treasury ETFs
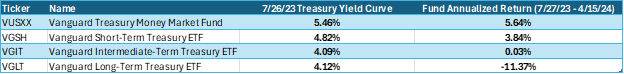
Next, we can see how those funds performed over time beginning the day after the Federal Reserve’s last interest rate hike. As we can see in the table, the shorter maturity funds outperformed the longer maturity funds suggesting that information from the yield curve was a significant indicator of future returns.
Table 2: Treasury Yield Curve vs Subsequent ETF Returns
For investment grade bonds, yield curves give investors substantial information about future bond returns that should not be ignored. They can use that information to position bond allocations to take advantage of the higher yielding portion of the yield curve.