On April 20, 2022, Netflix stock fell 37% following a disappointing earnings report the previous day. As a member of the FAANG group of large technology stocks (Meta “Facebook”, Amazon, Apple, Netflix, and Alphabet “Google”), it seemed like a good time to revisit a post we wrote back on October 30, 2020. In that post, “Will FAANG Stocks Continue their Dominant Outperformance”, we first reviewed the performance of those stocks relative to the overall U.S. market during both the recent period and longer term.
For reference, we created an equal-weighted FAANG portfolio composed of a 20% allocation to each stock. The FAANG portfolio returned 64.8% compared to 11.6% for U.S. stocks (Russell 3000 Index) and 6.1% for Global stocks (MSCI All Country World Index) over the previous year ending October 29, 2020. Over the longer term, we looked at the FAANG portfolio performance beginning May 18, 2012 (the date of Facebook’s initial public offering). Over that period, the FAANG portfolio achieved a total return of 1,379% compared to 208% for U.S. stocks and 127% for Global stocks. On an annualized basis the returns were 37.6%, 14.3% and 10.2% respectively.
As a result of this long-term outperformance, four of the five FAANG stocks were now among the top ten largest companies in the U.S. as measured by market capitalization (total number of shares multiplied by stock price) as of October 26th, 2020. (Netflix was ranked 24th).
We then posed the question, what should FAANG investors expect from this group of stocks going forward.
Without attempting to forecast specific expected returns, we used two approaches to help set reasonable expectations.
- We looked at the returns of all stocks both in the years prior to and after becoming top-ten sized companies.
- We looked at the proportion of the total stock market FAANG stocks would account for if they continued to outperform at the same rate they had since Facebook’s IPO.
One conclusion we could draw from these approaches was that FAANG investors in October 2020 should not expect future excess returns similar to what had been achieved previously. Eighteen months later, we can see what transpired. Below we compare the returns of the FAANG portfolio to the overall U.S. stock market.
Chart 1: U.S. Stocks vs FAANG Portfolio: October 30, 2020 – April 20, 2022
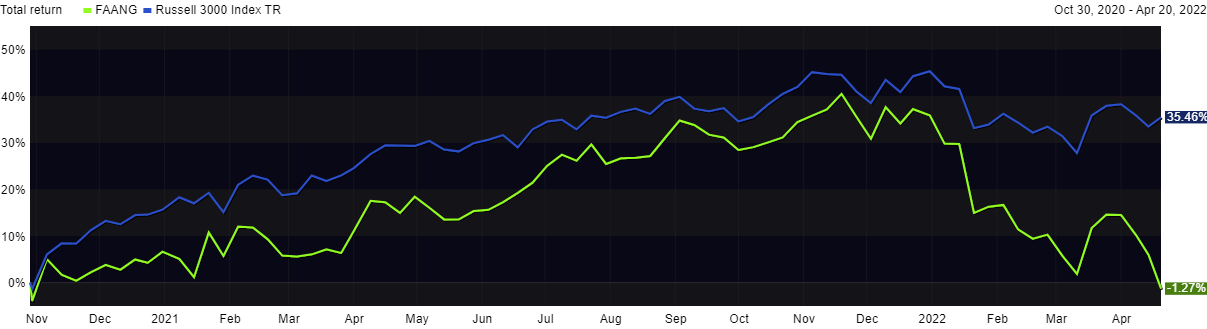
The FAANG portfolio underperformed U.S. stocks by roughly 37% over the period from October 30, 2020 to April 20, 2022.
The key takeaway here is to avoid falling in love with businesses. One might expect an equal-weighted portfolio composed of technology superstars like Meta “Facebook”, Amazon, Apple, Netflix, and Alphabet “Google” to hold its own verses the random assortment of thousands of U.S. companies. But stocks are priced to reflect expected future business performance. High growth companies generally have high priced stocks which means that an investment in that company should not be expected to provide a great rate of return even if the business continues to be successful.