
One of the fundamental questions clients ask is “how much can I spend in retirement?” Other versions of this question such as “when can I retire” or “will I have enough to retire” are also common. While a seemingly simple question, the reality is answering this question is remarkably difficult if you account for all of the complicating factors.
While a multitude of commercial software and online calculators exist that will generate answers given a set of inputs, we have never been comfortable relying on their output to advise clients. We have found that software will generally fall into two categories. 1) Overly simplistic calculators that are meant to generate an answer with a minimal amount of effort but gloss over critical complexity in the process or 2) commercial software that attempts to deal with the complexity but does so behind the scenes creating a ‘black box’ situation that reduces our confidence in the output.
As a result, we recently developed our own Fifth Set retirement spending tool to help clients understand how they are progressing toward their goals while also highlighting the inherent uncertainty in retirement spending plans.
Savings and Spending Example – The Simple Approach
Before we get to why retirement spending plan development is so difficult, it helps to look at a simple approach that you may have seen. If you Google “retirement income calculator”, the first result that comes up is from Vanguard. Clicking on the link brings you to a page that asks about “Your Retirement Story”. Below are the inputs it requests and sample data.
- Current Age – 40
- Retirement Age – 65
- Current income – $100,000
- Saving rate (in dollars or percentage) – 10%
- Current portfolio balance – $1,000,000
- Expected income replacement percentage – 75%
- Expected annual rate of return on your investments – 5%
- Expected Social Security benefit – $0
- Expected Pension benefit – $0
I hit “Calculate” and voilà, the calculator generates the following pieces of information.
- Portfolio balance at retirement – $1,941,300
- Estimated monthly expenses – $6,250
- Expected monthly spending (income) – $6,471
First, I’m very happy to see that my projected monthly income is projected to be higher than my projected expenses. Second, from here, if one were curious, they might click on the link “How did we calculate your results?” Here’s what it says…
Retirement Savings
“This is the retirement income that your current retirement plan will provide. To calculate it, we first determine how much you’ll have saved by the time you reach retirement (your “nest egg”). Then, we use the “4% rule” – that is, we assume that you can afford to spend approximately 4% of your initial nest egg each year in retirement and be reasonably confident that you won’t outlive your savings. The result is adjusted for inflation (3% annually).”
Seems reasonable enough but let us unpack the ways this approach fails in solving the retirement spending question.
Unpacking the simple approach to retirement spending projections – Issues that undermine Vanguard’s calculator.
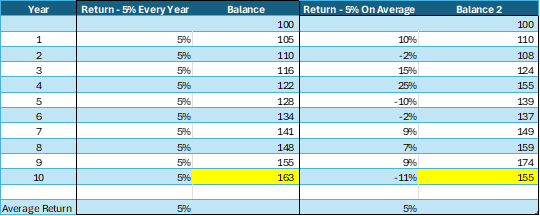
- Even if we knew future returns – Part 1 – Return Volatility – Vanguard’s calculator assumes that the expected portfolio return, 5% in this case, is achieved EACH YEAR. In reality, even if our returns turned out to be 5% on average, portfolio growth would still be less than Vanguard’s calculator suggests because of a concept called volatility drain. In the table below, assume two starting portfolios of $100 that both earn an average annual return of 5% per year for 10 years. One portfolio earns 5% EVERY year and the other earns different returns every year that averages 5%. Unfortunately, market returns look a lot more like the 5% on average portfolio than the 5% every year.
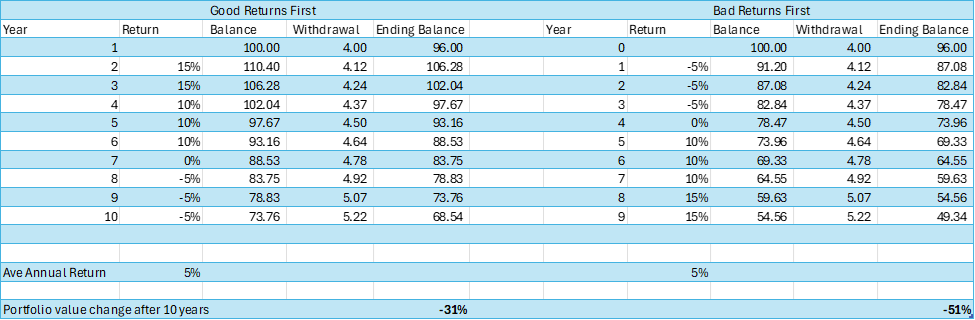
- Even if we knew the returns – Part 2 – Sequence of Returns – Assume we somehow found a crystal ball that told us the following: The exact annual returns for the portfolio for the next ten years. The only thing we don’t know, because we got the lower end crystal ball model on sale, is the ORDER of returns. How much would that impact the answer to our question. It turns out that it has a massive impact on portfolio balance and retirement spending. In the table below, assume two starting portfolios of $100 that both earn THE EXACT SAME ANNUAL RETURNS for 10 years. Both portfolios also experience up and down years, but one portfolio experiences the good years first and one experiences the bad years first. Spending is set at 4% of the initial balance and increased by 3% each year for inflation.
- The “4% Rule” used in the calculator can lead to dramatic underspending – In 1994, a financial planner named William Bengen did an experiment. He wanted to find out, using historical returns and a portfolio constructed of 50% large capitalization US stocks and 50% intermediate-term treasury bonds, what was the highest starting percentage of a portfolio that could be withdrawn with the dollar amount increased every year by the rate of inflation, for thirty years without depleting the portfolio. Bengen found that the maximum first year safe withdrawal rate that never ran out of money was 4.15%, or 4% to keep things simple. This became known as the “4% Rule”. So, for example, a 65-year-old retiree planning for a thirty-year retirement with a $1 million portfolio could withdraw $40,000 in year one. In year two, assuming 3% inflation, the retiree would withdraw and spend $41,200 and so on for thirty years. The nuance ignored by Vanguard’s calculator was the initial 4% was the maximum safe withdrawal rate if one started withdrawing money at the worst possible time in U.S. financial history (turns out that was October 1968). In a December 2025 interview[1], Bengen noted that the average safe withdrawal rate over that time period was about 7% meaning that had someone chosen to use the 4% rule and stuck to it, in most cases, they would have accumulated massive amounts of money due to underspending.
Retirement Spending Projection series – Part 2
In Part 2, we will look at issues that impact all approaches to retirement spending projections as well as how our Fifth Set retirement spending tool incorporates methodologies and techniques to better reflect real world market behavior and gain a better understanding of a client’s retirement spending path.
1 https://www.youtube.com/watch?v=joKcEVsl6M0